ITC Statistics Cases Instituted in 2025
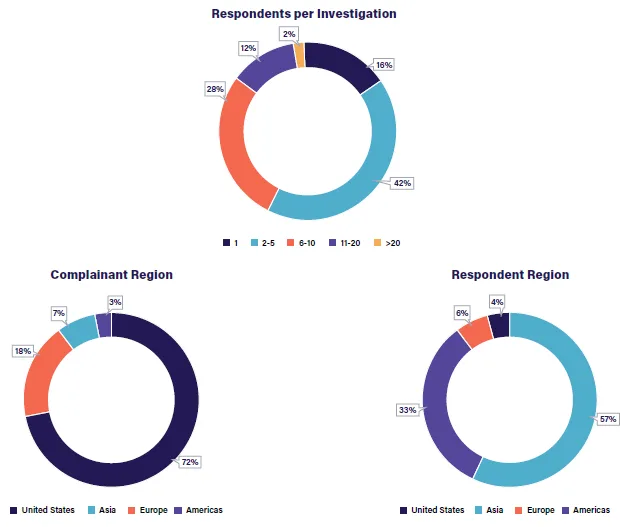
Respondent counts in the top chart reflect corporate consolidation. The regional charts on the bottom count related corporate entities in different regions independently.
 In 2025, on average, from institution…
- 5.4 months to Markham hearing
- 17.4 months to target date
This article appeared in the 2025 ITC Section 337 Year in Review: Analysis & Trends report.
© 2026 Sterne, Kessler, Goldstein & Fox PLLC
Related Services
Stay in the Know
Receive insights from the most respected practitioners of IP law, straight to your inbox.
Subscribe for Updates