By: Mark W. Rygiel and Patrick T. Murray
The statistics below reveal the current trends on proceeding breakdowns, institution rates, and outcomes of design patent PTO litigation. Since February 2017, with 13 additional design patent institution decisions the institution rate has remained relatively steady at 40% (from 37%), still significantly lower than the overall institution rate.
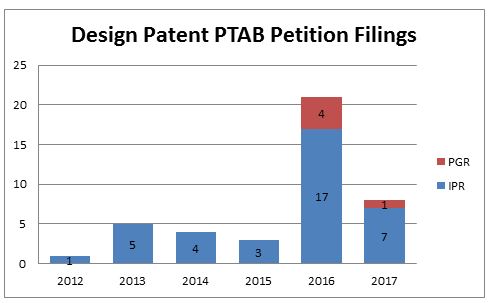
I. Proceeding Breakdown
| Year | IPR | PGR | Grand Total |
| 2012 | 1 | 1 | |
| 2013 | 5 | 5 | |
| 2014 | 4 | 4 | |
| 2015 | 3 | 3 | |
| 2016 | 17 | 4 | 21 |
| 2017 | 7 | 1 | 8 |
| Grand Total | 37 | 5 | 42 |
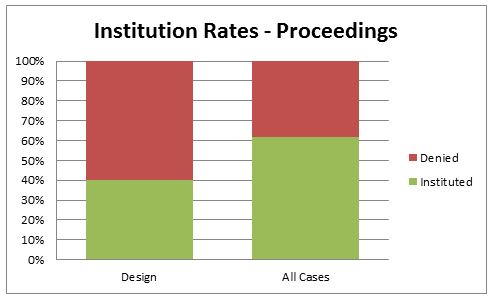
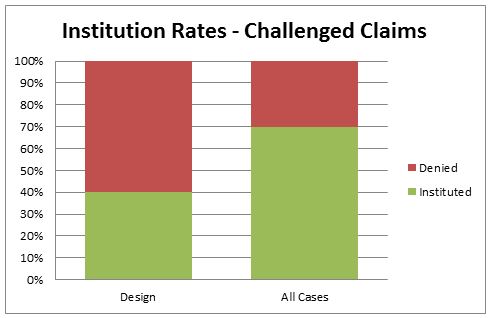
II. Institution Rates/Case Statuses
The institution rate for design patents, for both claims and proceedings, is 40% (16/40).
For cases overall, the proceeding institution rate is 70%, and the claim institution rate is 62%.
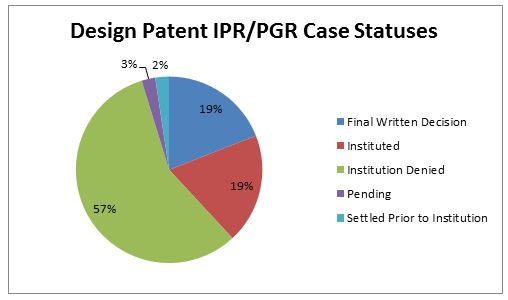
Here is a breakdown of the current case statuses for all of the design cases:
| Status | Total |
| Final Written Decision | 8 |
| Instituted | 8 |
| Institution Denied | 24 |
| Pending | 1 |
| Settled Prior to Institution | 1 |
| Grand Total | 42 |
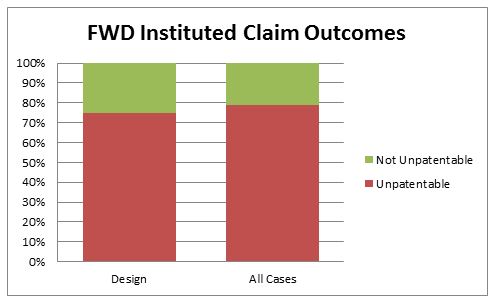
III. Final Written Decision (FWD) Outcomes
A. Claim Cancellation Rate
The instituted claim has been cancelled in 6 of 8 design FWDs (75%). The overall claim cancellation rate is 79%.
B. FWD Ground Type
| FWD Ground Type | Grand Total | ||
| Claim Outcome | 102/103 | 103 | |
| Not Unpatentable | 2 | 0 | 2 |
| Unpatentable | 3 | 3 | 6 |
| Grand Total | 5 | 3 | 8 |
C. FWD Prior Art Type
| Trial Number | FWD Ground Type | FWD Prior Art Type |
| IPR2016-00130 | 102/103 | NPL |
| IPR2015-01453 | 102/103 | NPL |
| IPR2015-00416 | 103 | NPL/Patent |
| IPR2015-00306 | 103 | Patent |
| IPR2013-00580 | 102/103 | Patent |
| IPR2013-00501 | 102/103 | Patent |
| IPR2013-00500 | 102/103 | Patent |
| IPR2013-00072 | 103 | Patent |
FWD Prior Art Type
| Claim Outcome | Patent | NPL | Both | Grand Total |
| Not Unpatentable | 0 | 2 | 0 | 2 |
| Unpatentable | 5 | 0 | 1 | 6 |
| Grand Total | 5 | 2 | 1 | 8 |
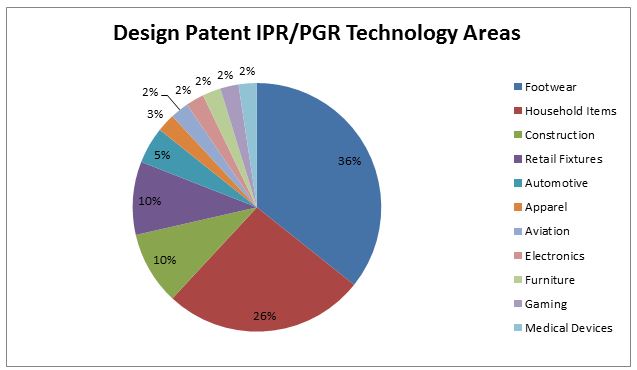
IV. Technology Areas
| Tech Area | # |
| Footwear | 15 |
| Household Items | 11 |
| Construction | 4 |
| Retail Fixtures | 4 |
| Automotive | 2 |
| Apparel | 1 |
| Aviation | 1 |
| Electronics | 1 |
| Furniture | 1 |
| Gaming | 1 |
| Medical Devices | 1 |
This article appeared in the July 2017 issue of The Goods on IP® Newsletter.
Receive insights from the most respected practitioners of IP law, straight to your inbox.
Subscribe for Updates